

Where Physics Meets Finance: Site-Level Risk in Solar + Storage

– 22 min read
An Energyshed white paper on the Quanta Analytics framework and the Energyshed Score
Methodology preview · Ezra Green · November 2026 · energyshed.ai
Clean energy and storage projects are financed on forecasts, and the operating fleet keeps missing them. Lenders, investors and insurers carry the cost of those misses, while the engineering often takes the blame. In kWh Analytics’ 2024 study of 301 US utility-scale solar sites, the median site produced 91% of its forecast [1].
Every forecast starts from the manufacturer’s ratings: a panel’s efficiency at turning sunlight into electricity, and a battery’s round-trip efficiency (RTE), the share of the energy put in that comes back out over a full charge and discharge. Large utility plants and smaller mainstream systems match those hardware ratings about equally well, and that is where the similarity ends.
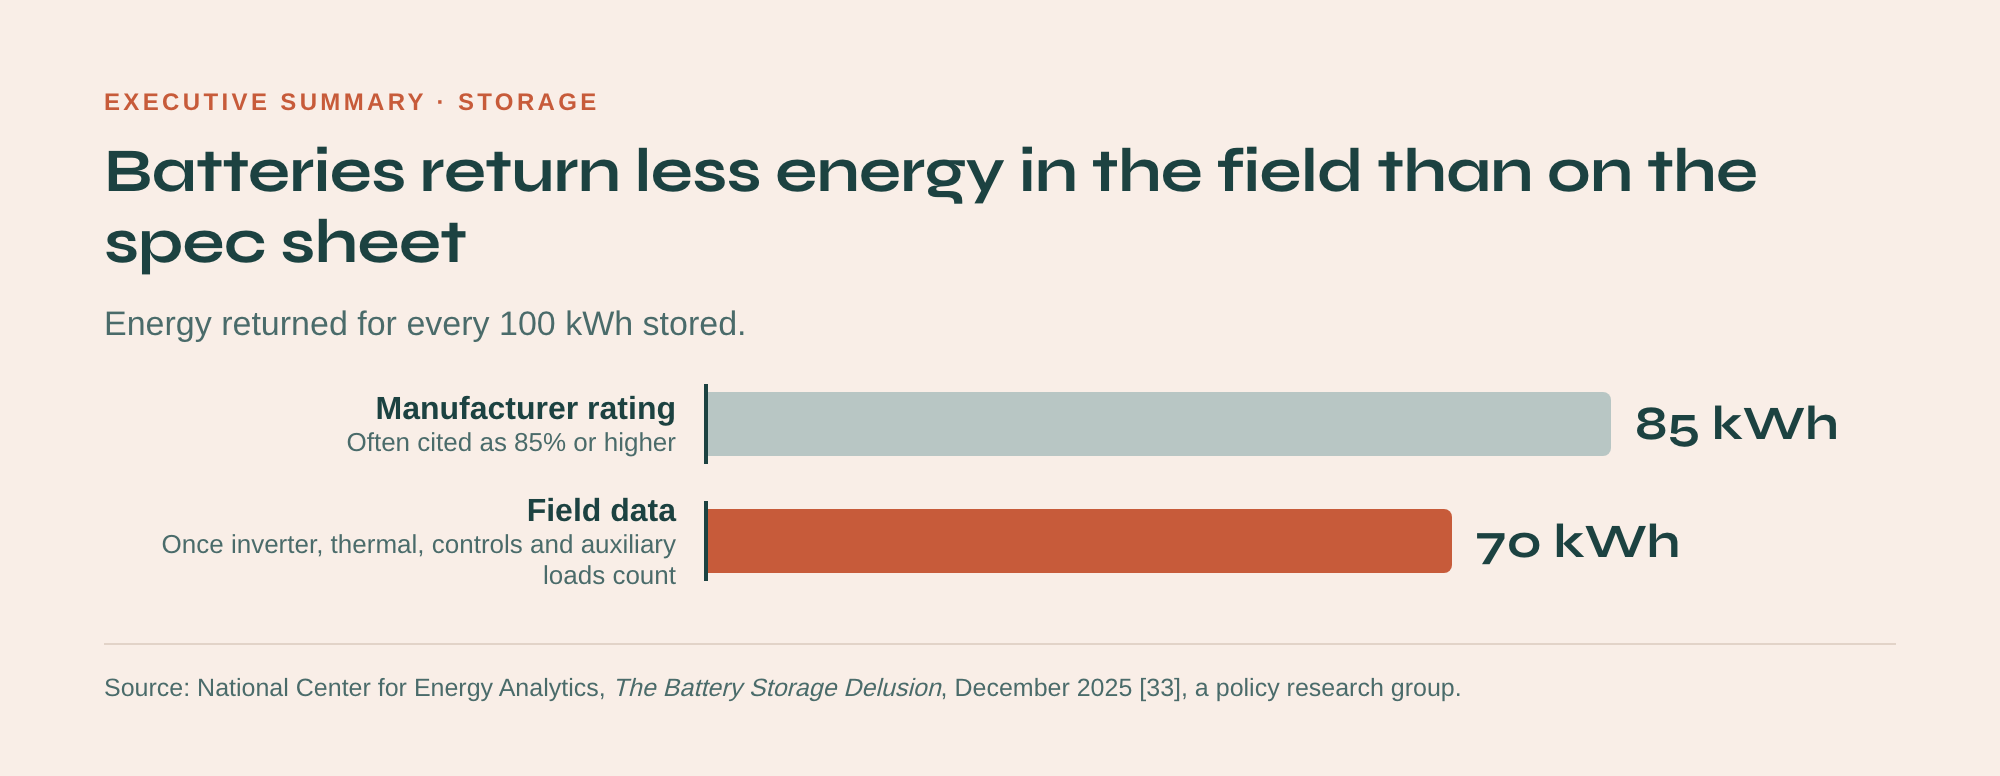
Large systems are heavily engineered, while mainstream systems are usually designed to nameplate with a few adjustments. Both run into the same real-world conditions, starting with the site. The National Center for Energy Analytics, a policy research group, notes that manufacturers often cite round-trip efficiencies of 85% or higher, while field data suggest closer to 70% once inverter losses, thermal management, controls and auxiliary loads are counted [33].
Manufacturer efficiency ratings have not been shown to hold over a battery’s full cycle life, and cycling a battery more deeply shortens that life.
Depth of discharge, usable energy and efficiency look much the same across systems at commissioning, and degradation separates them soon after operation begins. Sodium-ion, LFP and NMC lithium-ion each have their place, with different nameplate ratings and different tolerance for heat, cold and cycling. Other battery designs are still in development, and they will likely serve specialty applications.
On the storage side, EPRI’s failure database shows that only 11% of classified battery failures start in the cells. Most start in integration, controls and thermal systems, and 72% of failures with a known age happen during construction, commissioning or the first two years of operation [2].
Those studies, like most public performance data, cover plants of 1 MW or more. Those plants get the most engineering attention, and they still miss their forecasts by wide margins. The federal database of US solar facilities stops at that size and lists about 6,600 such plants [27].
The market that most needs attention looks very different. The US passed 6 million solar installations in the first quarter of 2026 [28], so all but a few thousand of them are rooftop and commercial systems below 1 MW. Utility plants still added most of the new solar capacity in 2025, 34.7 GWdc [4], but commercial solar grew 6% that year while utility-scale fell 16% [4].